ClawGraphics
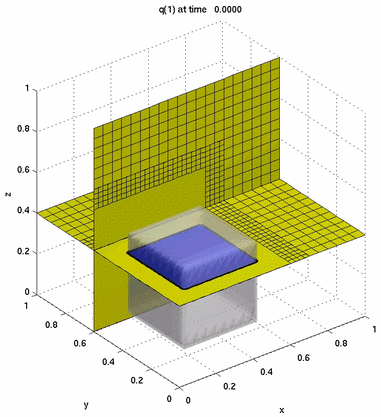
Solution to 3d Burgers equation using adaptive mesh refinement. The results were computed using Clawpack, and the visualization done using Matlab routines described below.
I've contributed to a suite of Matlab routines for plotting the results of Clawpack. These routines can be used as an alternative to the newer Python routines now available in Clawpack. Like the Python routines, ClawGraphics reads the output files created by Clawpack, and plots the results. To use these routines, it is assumed that you are somewhat familar with Clawpack, a package of fortran routines which implements finite volume schemes for solving hyperbolic problems on logically Cartesian grids.
Here is a brief outline of how you can use these routines.
- Download the tarball (matlab.tar.gz)
- Move the tarball to a suitable directory (under your main Clawpack
directory, for example)
Linux% cd
Linux% mv Downloads/matlab.tar.gz $CLAW
- Untar and unzip the file
Linux% cd $CLAW
Linux% tar -zxvf matlab.tar.gz
- Set the MATLABPATH environment variable. For example,
if you are using the Unix shell tcsh, you can set the
environment variable using
Linux% setenv MATLABPATH=$CLAW/matlab:$MATLABPATH
You will probably want to include this in your .bashrc or .cshrc files.
- Run your Clawpack example. From your working directory,
start Matlab. From the Matlab prompt, try
>> plotclaw2
to plot 2d results, for example. Also available are plotclaw1 and plotclaw3.
- You can see list of available routines in ClawGraphics by
typing
>> help clawgraphics
at the Matlab prompt. You should see this list.
These routines can also be used for output from software from other packages. If you'd like information on how to do this, you can create your own version of readamradata. For help on this routine, type
>> help readamrdata
at the Matlab prompt. If you call your routine readamrdata_mydata.m, ClawGraphics will read it if you set the OutputFlag in the setplot routine to "mydata". Type
>> help setplot
for more information on the setplot routine.
Last modified: Mon Jun 27 11:30:40 PDT 2011